
Planar graphs and maps
Typically, maps can be represented by planar graphs. Planar graphs are graphs that can be drawn without their edges intersecting.
For example, the following is a planar graph:
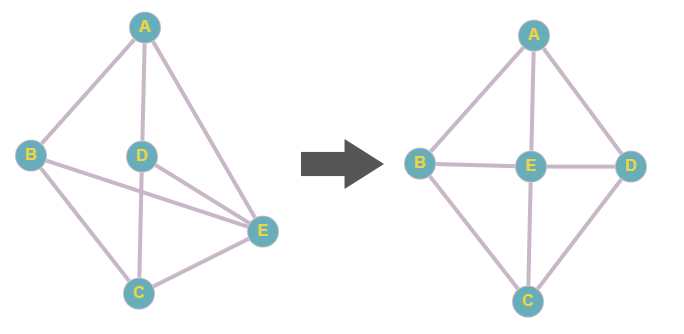
On the right, we have a representation without any edge crossing another.
On the contrary, the following isn’t a planar graph:
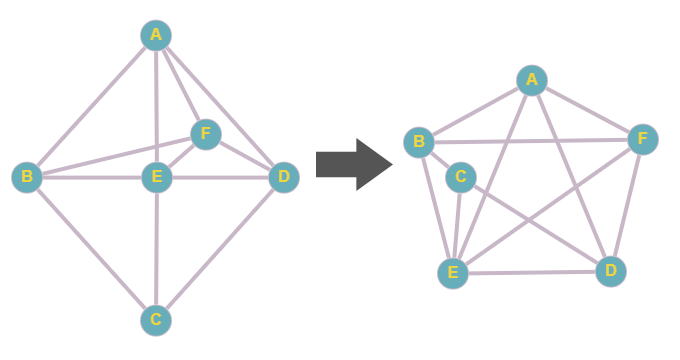
A proof that it isn’t a planar graph is the representation on the right, which shows that this graph contains a subdivision of \(K_5\). By Kuratowski’s theorem, this is not a planar graph.
As stated before, maps often can be represented by planar graphs. For this to be possible, the following conditions must be true:
- All “territories” or “countries” must be contiguous. For example, an US-Alaska or Russia-Kaliningrad situation is not allowed.
- The maximum amount of regions that could meet at a corner or vertex is 3. It can’t exist a 4-way border or higher. For example, the Four Corners in the US isn’t allowed in a planar representation.
With this introduction, let’s see two interesting facts about maps with their relationship to planar graphs.
4-color theorem
The 4-color theorem states that any map (following the conditions we have given) could be colored using at most 4 colors so that two adjacent territories are of a different color. It was proved originally in 1976 by Kenneth Appel and Wolfgang Haken using computers. After decades of controversy, the proof has been simplified and verified several times also using theorem proving software.
A similar theorem, the 5-color theorem, which is similar but with 5 colors has a much simpler proof that could easily be done by hand.
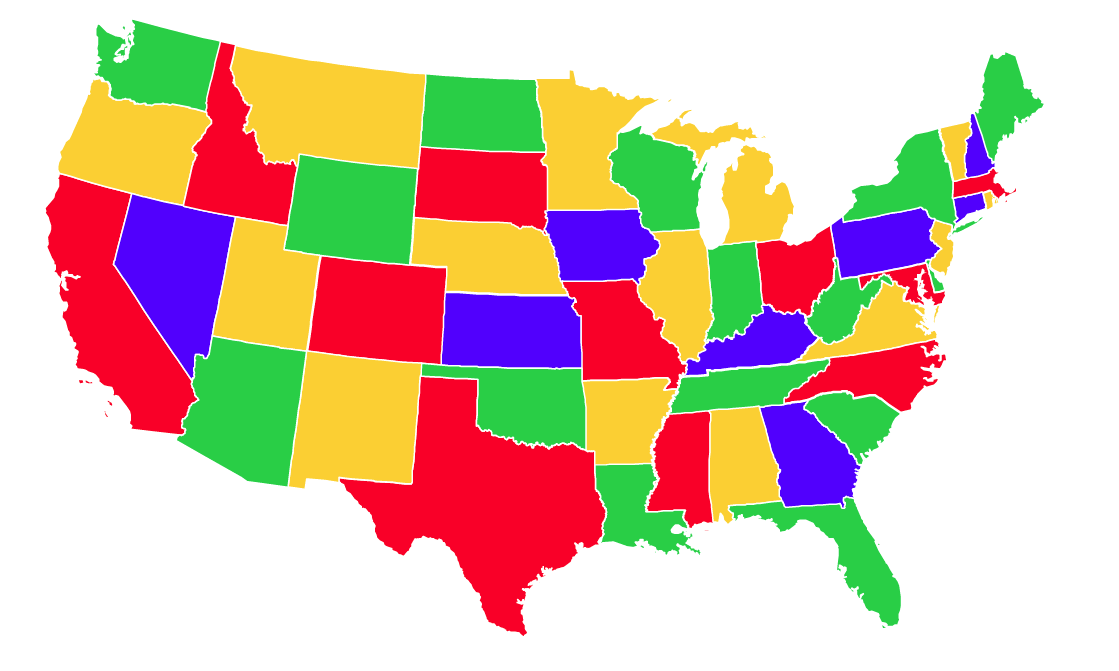
A map of the US using only 4 colors.
Note that both Utah and New Mexico had been painted in yellow while there is technically a border between them. This is, as we mentioned, because it can’t exist a 4-way border or higher.
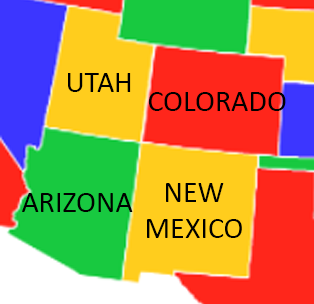
The four corners

An invented map with strange borders also following the 4-color theorem.
Relationship between territories, borders and tripoints
Following Euler’s formula for planar graphs, we could establish a relationship between the number of territories, borders and tripoints (point of meeting of the boundaries of three territories).
Given Euler’s formula: \(v - e + f = \chi\)
We will consider \(v\) the number of territories, \(e\) the number of borders between any two territories and \(f\) the number of tripoints. Also, we will consider Euler characteristic \(\chi = 1\).
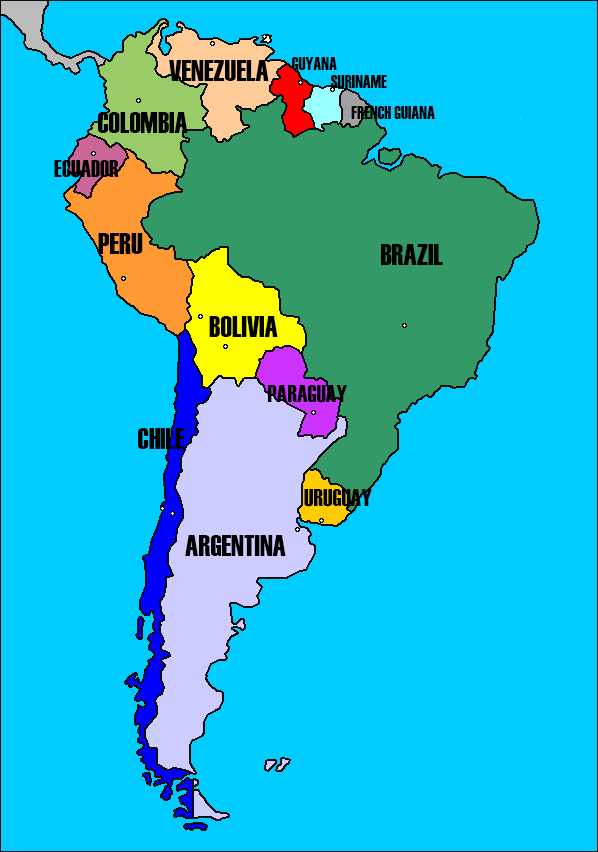
For example, let’s consider the map of South America. Here there are 13 different territories (12 countries and the French Guiana):
Counting the number of borders, we could find that there are 25:
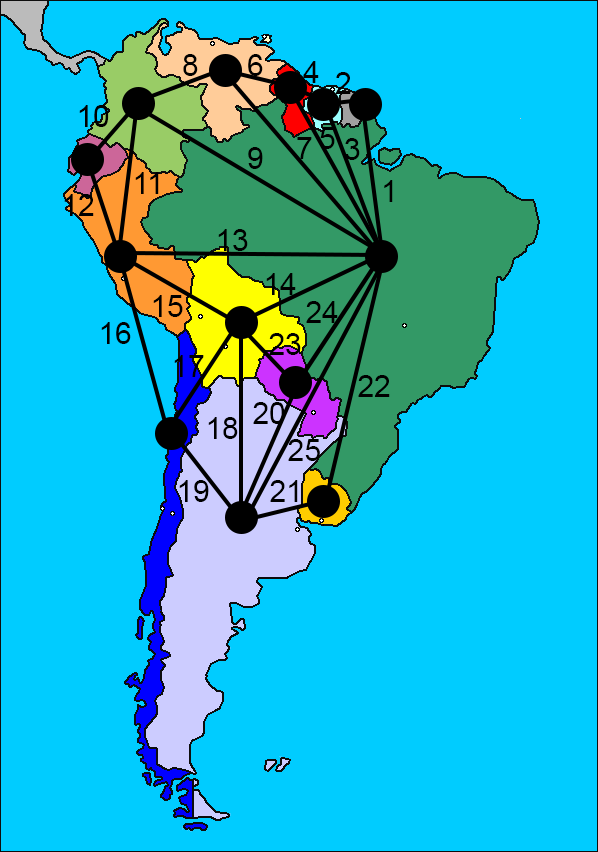
So, using Euler’s formula we can find the number of tripoints:
\[v - e + f = \chi\] \[13 - 25 + f = 1\] \[f = 13\]Let’s see if this number is correct:
- Brazil - French Guiana - Suriname
- Brazil - Suriname - Guyana
- Brazil - Guyana - Venezuela
- Brazil - Venezuela - Colombia
- Brazil - Colombia - Peru
- Brazil - Peru - Bolivia
- Brazil - Bolivia - Paraguay
- Brazil - Paraguay - Argentina
- Brazil - Argentina - Uruguay
- Colombia - Ecuador - Peru
- Peru - Bolivia - Chile
- Bolivia - Chile - Argentina
- Argentina - Bolivia - Paraguay
As a side note, we used Euler characteristic of \(\chi = 1\) although for planar graphs it is \(\chi = 2\). This is because we only counted as faces \(f\) the tripoints between countries. But there is an extra face, on the outer zone of the graph.
Here we could see the 13 tripoints or faces of the graph, and a face number 14 that corresponds to the outer part of the graph:
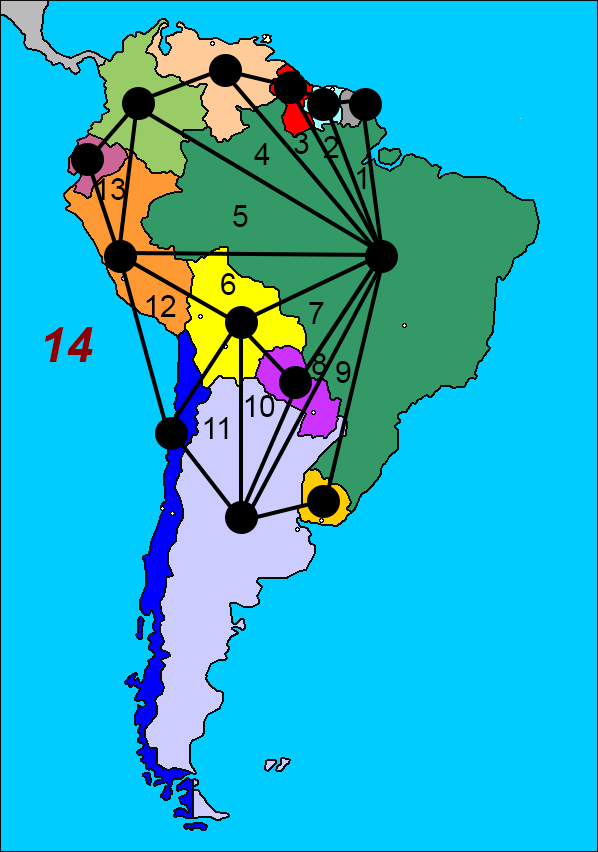
So, as we substracted 1 from \(f\), we could also subtract 1 from \(\chi\) to maintain the Euler formula unaltered.


Comments